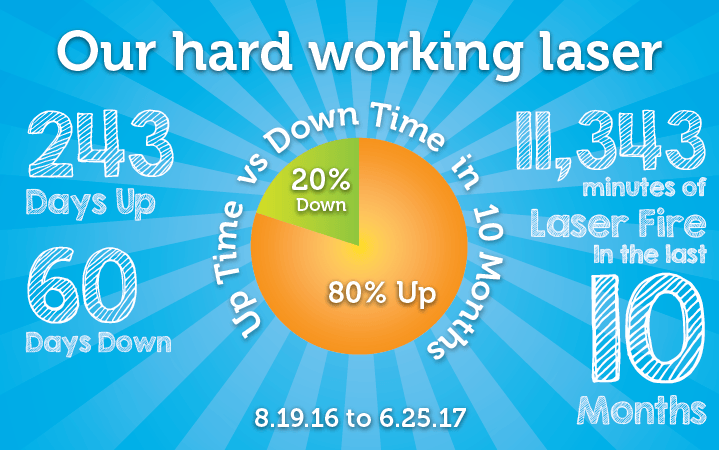
Human beings are conditioned to remember negative things more readily than positive. When it comes our laser the times it is not working stick out much more than the times it is. I got curious about how often it was really down vs how much it “felt” like it was down. So I went searching the logs for the real story.
What I found out was that for a heavily used volunteer run and maintained piece of equipment out laser does pretty good. When you factor in the make and model, years of community use and that it is all run and managed by volunteers 80% up time is nothing to sneeze at. This is thanks to great stewardship by Peter and a lot of effort by dedicated volunteers.